Three Six Mafia
Most guys my age have "the chat". The one with your college buddies that only exists to share memes, argue, bully, and occasionally announce that you got a promotion or had a kid. I am like most guys.
Recently the discussion switched to the Three Six Rule. The idea that, to be date-able, a guy must be a 6 in 3 categories:
- 6 figure income
- 6 feet tall
- 6 inch pecker
I'm pretty far from 6 feet. You can make any other assumptions you wish. However, I'm happily married. What's the deal? Was my wife ignorant of the rule; did she take pity on me? Or perhaps it's possible to compensate for poor performance in one area with exceptionalism in another. If so, what is the conversion rate and is there an opportunity for arbitrage?
These are the important questions of our day.
The Approach
Back in your very first stats class you probably talked about the heights of third-graders, and someone drew a pretty bell curve. Distribution of heights is like bell curve 101, and bell curves are incredibly useful. With just two numbers, a mean (μ) and standard deviation (σ), you can describe an entire population and run all types of analysis.
Where I live in the USA being 6' or great is actually pretty rare. 91% of all adult men are below this height. However, older people tend to shrink with age and are far less likely to be in the dating pool. Especially for a connoisseur of the Three 6 Rule. Let's only look at American males between the ages of 20 and 30.
Height Distribution of Males aged 20-30
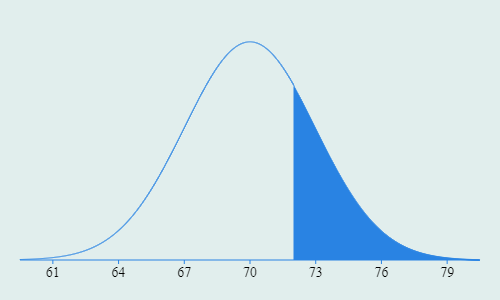
$$\mu = 70"$$ $$\sigma = 3"$$
A height of 6' is roughly at the 75th percentile. Hold up, percentile? We're not talking about SAT scores you nerd. We're drastically eliminating men from the dating pool based on three arbitrary numbers. Let's subtract it from 1 and call it an "Exclusivity Score".
Much better. By eliminating guys under 6' we have removed 75% of the population from the dating pool and are left with the top quartile of most exclusive men. In a room of 100 fellas, 75 aren't even worth talking to.
Now what about pecker size? Fortunately, this also follows a pretty standard bell curve and there's public data so I don't have to do my own research. A 6" wiener is even rarer than being 6' tall. The average erect penis length is 5.166" with a std dev of 0.654".
Erect Penis Length Distribution
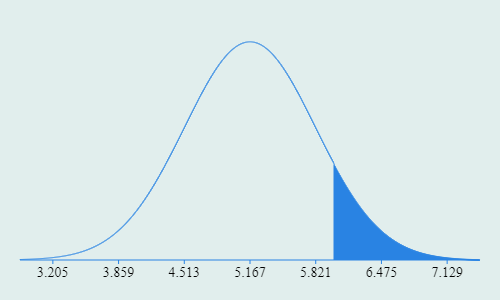
$$\mu = 5.166"$$ $$\sigma = 0.654"$$
Do the math, carry the 1, and a 6" pecker puts you right at the 90th percentile for an Exclusivity Score of 10%.
In that same room, we've eliminated 90 of them for having the pedestrian member of a mere mortal. The 10 guys left are the cream of the crop.
Getting Too Big for Our Britches
Here is where we starting getting a little dumb. I've got a room of 100 potential dating partners. 25 of them meet my height criteria while 10 of them have exclusive enough peckers. What are the odds that somebody is in both groups?
To combine the odds of two independent actions, you just multiply them. The odds of rolling a die and getting a 5 are 1/6. The odds are doing it a second time are also 1/6. So the odds of rolling 5 two times in a row are:
$$\frac{1}{6} * \frac{1}{6} = \frac{1}{36} = 2.778\%$$
What if the actions aren't independent? If I take a deck of cards and draw one randomly, there is a 1 in 2 chance it is red. If I keep that card, what are the odds the next card I draw is also red? It's not 1 in 2. The deck now has 51 cards, 26 black cards and 25 red cards. On my second turn, the odds of drawing a red card are 25 in 51. Just slightly worse than 50/50. The odds of the second action are dependent upon the first action. The odds of drawing two red cards in a row are:
$$\frac{1}{2} * \frac{25}{51} = \frac{25}{102} = 24.51\% $$
Height and pecker length seem to be correlated, but there isn't a lot of great data out there. But generally speaking, a taller person is more likely to have a longer pecker. Since we can't model this relationship with a high degree of confidence, and because this exercise is incredibly low stakes, we're going to ignore it. While there appears to be some dependent relationship between height and pecker, I'm going to treat them as two independent events.
So back to these two groups of 25 and 10 guys. Since we're treating them as independent characteristics we can just multiply the odds to arrive at our Blended Exclusivity Score.
$$\frac{1}{4} * \frac{1}{10} = \frac{1}{40} = 2.5\%$$
Now we're talking! The Three 6 rule is really starting to shine in it's ability to enforce exclusivity. In a room full of 100 random guys, you may find two or three that can meet our criteria so far.
Let's Talk About Money
Humans have gotten bigger over time. However, I've yet to see height or pecker size in any CPI basket-of-goods when measuring inflation. Neither party's economy policy is to blame for the rising cost of peckers in the grocery store that is destroying the middle class. The heights of American men aren't driven by interest rate policy. Incomes are.
So when we talk about a 6 figure income, we need to nail down a date. For now we'll look at 2014 since that is the most recent data I found.
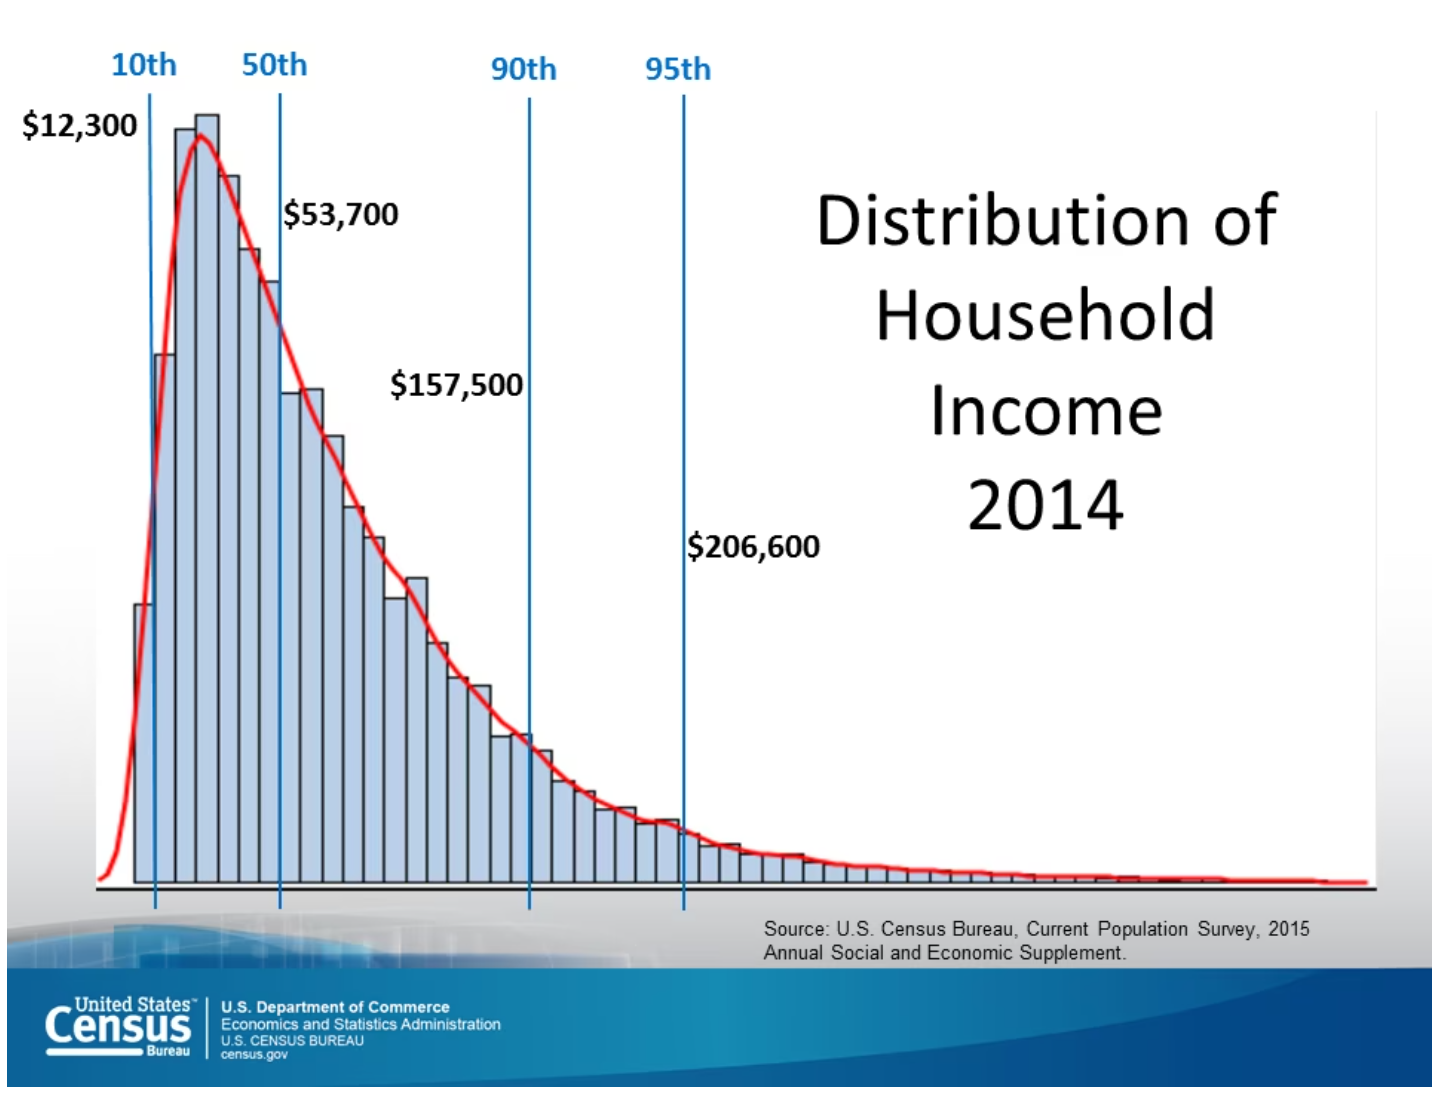
The other trouble with distributions of income is they aren't normal. Look at that long tail off to the right. But if we take the natural log of our incomes, it suddenly becomes normalized with a mean of 10.8 and standard deviation of 0.758. We can always convert our values back to dollars by raising e to that number as the exponent.
Income Distribution
Normalized with Natural Log
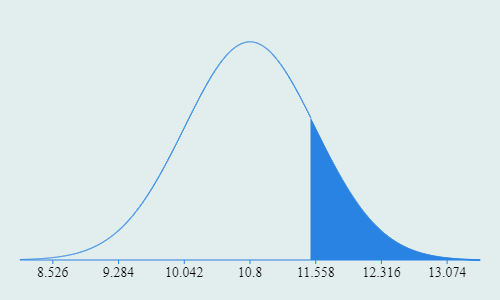
$$\mu = 10.8$$ $$\sigma = 0.758$$
Taking the natural log of $100k gives you 11.513 or an Exclusivity Score of 17%. To illustrate that 11.513 corresponds to $100k we can quickly check:
$$e^{11.513} = $100,007$$
Setting a Baseline
We already talked about the odds of finding someone in a group of 100 guys that is both 6' tall and 6" endowed. If we add in their salary we arrive at our Improved Blended Exclusivity Score.
$$BES = \frac{1}{4} * \frac{1}{10} * \frac{17}{100} = \frac{17}{4,000} = 0.425\%$$
In a gaggle of 100 suitors, it's actually unlikely that a single one will meet all three criteria. Perfection. We now have a truly unreasonable set of standards by which to choose our dating partner.
Even better, we now have a standard by which we can measure other permutations of height, pecker length, and income. As long as we remain more exclusive than 0.425% of the population we can explore the data and start to answer the big questions:
- Can you still date someone that is 5'3" if their income is $200k+?
- How tall does someone need to be to compensate for a micro-penis?
- Is there a pecker length at which height and income become irrelevant?
Sure, we're not following the letter of the law, but Jesus told me to follow the spirit of the law. I'm pretty sure this is what he was talking about.
Diving In
Let's hold income steady at $100k for a bit and focus on just height and pecker so we can start building a model for conversion. Remember that our mean height is 70" with a std dev of 3". This means that for every inch we grow, we move 0.333 std dev from the mean. At 6' we are 0.666 std dev from the mean.
Meanwhile, every inch that our pecker grows moves us 1.53 std dev from the mean. An inch of pecker is worth a lot more than an inch of height when measuring our Blended Exclusivity Score. How much more?
We already determined that our target Blended Exclusivity Score (BES) is 0.425%. If we hold salary constant at $100k, which has an exclusivity score of 17%, we can choose any length of pecker and determine the minimum height required to reach 0.425%.
$$ES_{Height} * ES_{Pecker} * ES_{Salary} = BES$$ $$ES_{Height} = \frac{BES}{ES_{Pecker} * ES_{Salary}}$$ $$ES_{Height} = \frac{0.425\%}{ES_{Pecker} * 17\%}$$
Since we need to use Exclusivity Scores (ES), not inches, we will use some excel functions to make this easier. To find the ES of a certain pecker we type in:
$$ES_{Pecker} = 1 - NORM.DIST(Length, \mu_{Pecker}, \sigma_{Pecker}, true)$$
To take an Exclusivity Score and convert it back to a height we just do the inverse function:
$$Height = NORM.INV(1 - ES_{Height}, \mu_{Height}, \sigma_{Height}) $$
If we build a table for various pecker lengths roughly between -3σ and +3σ and throw it on a chart, we get something like this. Notice that for 6" peckers we need the predicted ESHeight of 25% which corresponds to 72":
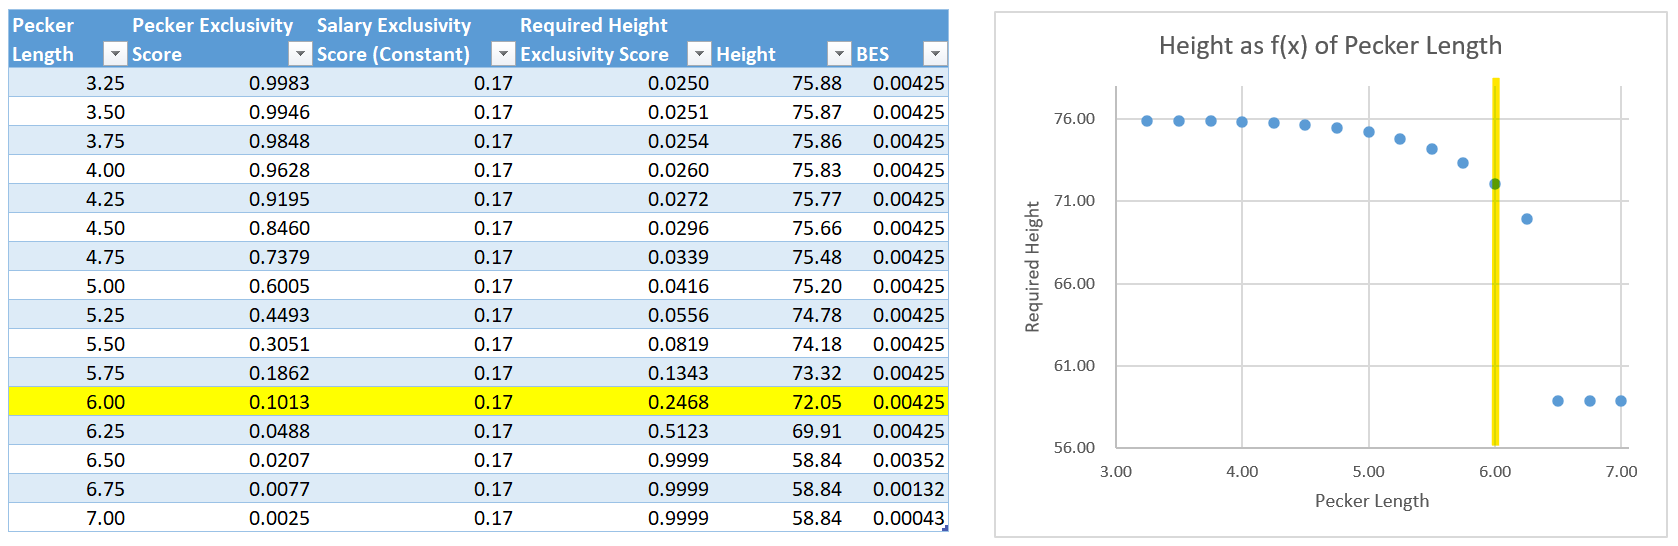
Now this is an interesting chart. On the shorter end of the penile spectrum our height is essentially flat at almost 6'6". At the extreme short end of pecker length there is very little exclusivity difference between 3.25" and 4.25". They're so small that you have to be on the extreme end of the height curve to get back to a BES of 0.425%.
In the middle of the chart, we see the steady curve that we likely expected where height is being driven by pecker length.
Then we reach the right side of the chart and things get crazy again. Once our pecker length reaches 6.5" (2σ from the mean), our ESPecker score becomes so high that height becomes a non-factor. In fact, ESPecker * ESSalary is already more exclusive than our target of 0.425%. Exclusivity score have to be between 0 and 1. There is no number in that range you can multiply by to get a bigger number. This creates the concept of a valley that we'll come back to.
Let's do this one more time but hold pecker size constant at 6". This time we will measure the salary required for various heights to maintain our BES. To measure our required salary, we do the same thing as before except we also have to convert our normal distribution back to dollars.
$$ES_{Salary} * ES_{Pecker} * ES_{Height} = BES$$ $$ES_{Salary} = \frac{BES}{ES_{Pecker} * ES_{Height}}$$ $$ES_{Salary} = \frac{0.425\%}{17\% * ES_{Height}}$$
Again we need to convert our heights into Exclusivity Scores using Excel:
$$ES_{Height} = 1 - NORM.DIST( height, \mu_{Height}, \sigma_{Height}, true)$$
This will give us our salary exclusivity score. Not only do we need to convert our Salary ES back to a number, we also need to raise e to that power to convert it back into dollars.
$$Salary = e^{NORM.INV( 1 - ES_{Salary}, \mu_{Salary}, \sigma_{Salary)}}$$
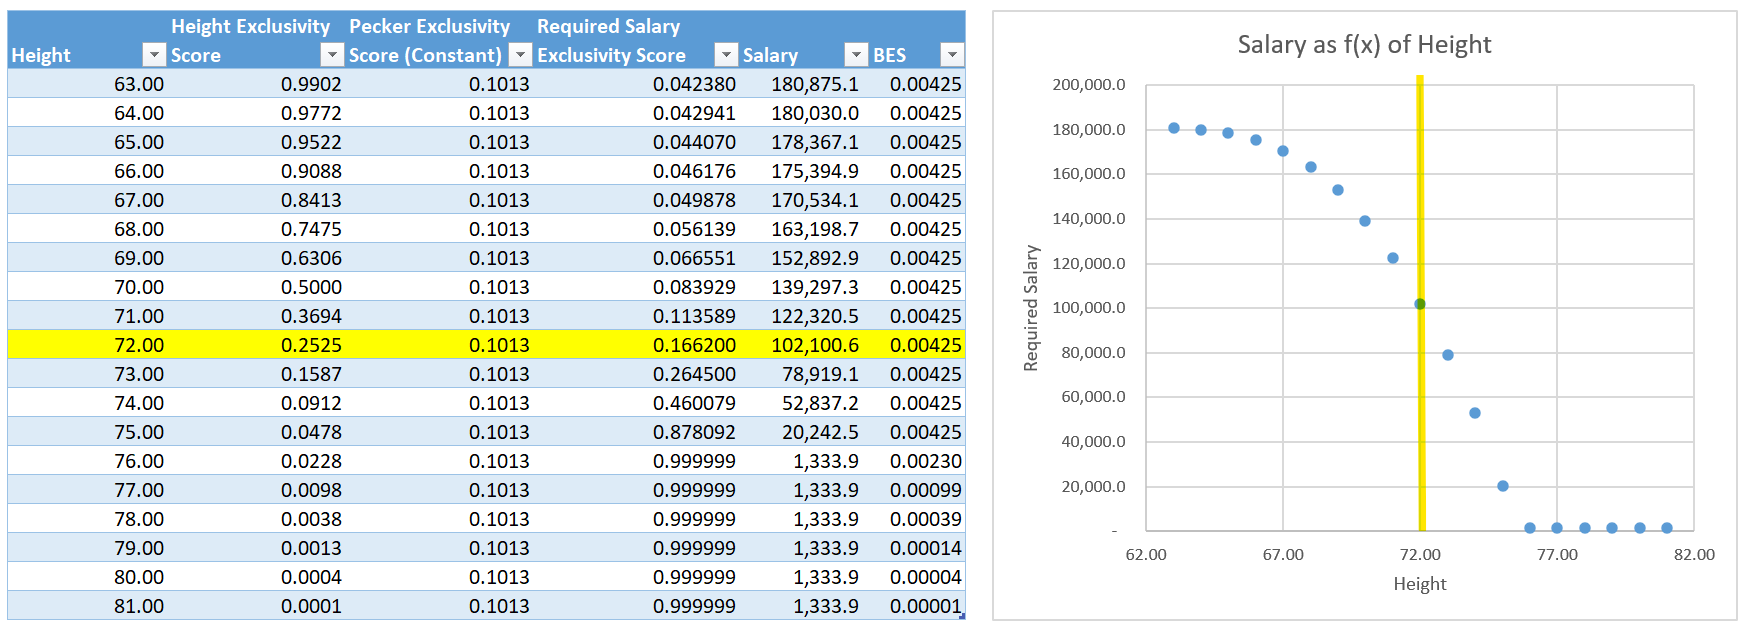
We have another valley on the right hand side. Once you reach heights of 6'4" with a 6" pecker, those two factors alone make you so exclusive that salary becomes irrelevant. These guys are such a catch that we can ignore their income entirely. I call this the "Valley of the Sexy Hobo".
We can continue this exercise for all combinations, but I know the reason why you're still here. You want an executive level view where you can quickly determine your own Blended Exclusivity Score. I got ya.
Let's start building some views we can action on. Something to laminate and keep in your wallet for that next round of speed dating. I promise this data will come across as very convincing and not at all creepy.
We'll start by building a simple data table, heights on the x-axis and pecker length on the y-axis. Both axis roughly represent plus or minus 3σ. Fill out our data table with required incomes, add a heat map, and voila.
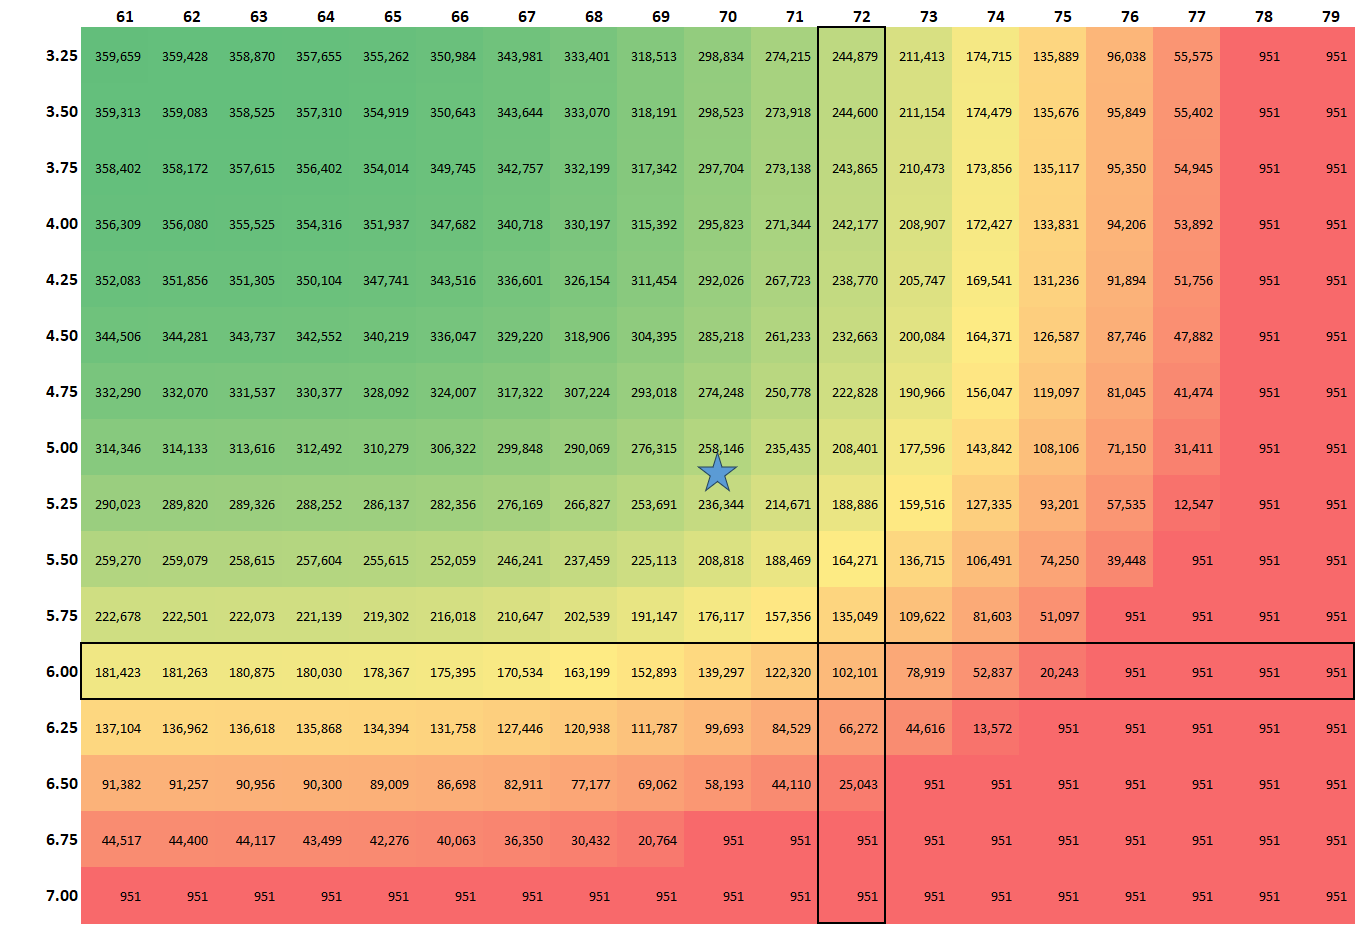
Let's gather some insights. I've highlighted the intersection of 6' and 6" while the star represents the average height and pecker length. Notice that a man who is physically average needs an income of roughly $250k to meet the same criteria as our ideal Three 6 man, that's a fairly exclusive salary. Income increases drastically as you move left and up the chart, and quickly drops to our floor of $951 as you move down and to the right.
The really interesting stuff with bell curves happens at the extremes. Now our "Valley of the Sexy Hobo" is two-dimensional. It wraps around the entire bottom and right of the table. And on the top left we have the "Peak of the Emasculated Rich".
The other interesting thing with bell curves is their distribution, how wide they are. We'll dive deeper into the value of an inch later, but for now we can start to see some trends. An inch of pecker is worth way more than an inch of height, so we need to compare standard deviations.
Our ideal Three 6 man is 1.27σ above the pecker mean, but only 0.66σ above the height mean. If he was interested in increasing his BES, he could get out sized returns by focusing on penile growth. With just 1σ of pecker length (0.65") he will drop into the "Valley of the Sexy Hobo". However, if he grows by 1σ he still needs to earn $20k. I'd hate to be the man tearing up my 2 week notice because I paid for the wrong growth surgery. How embarrassing.
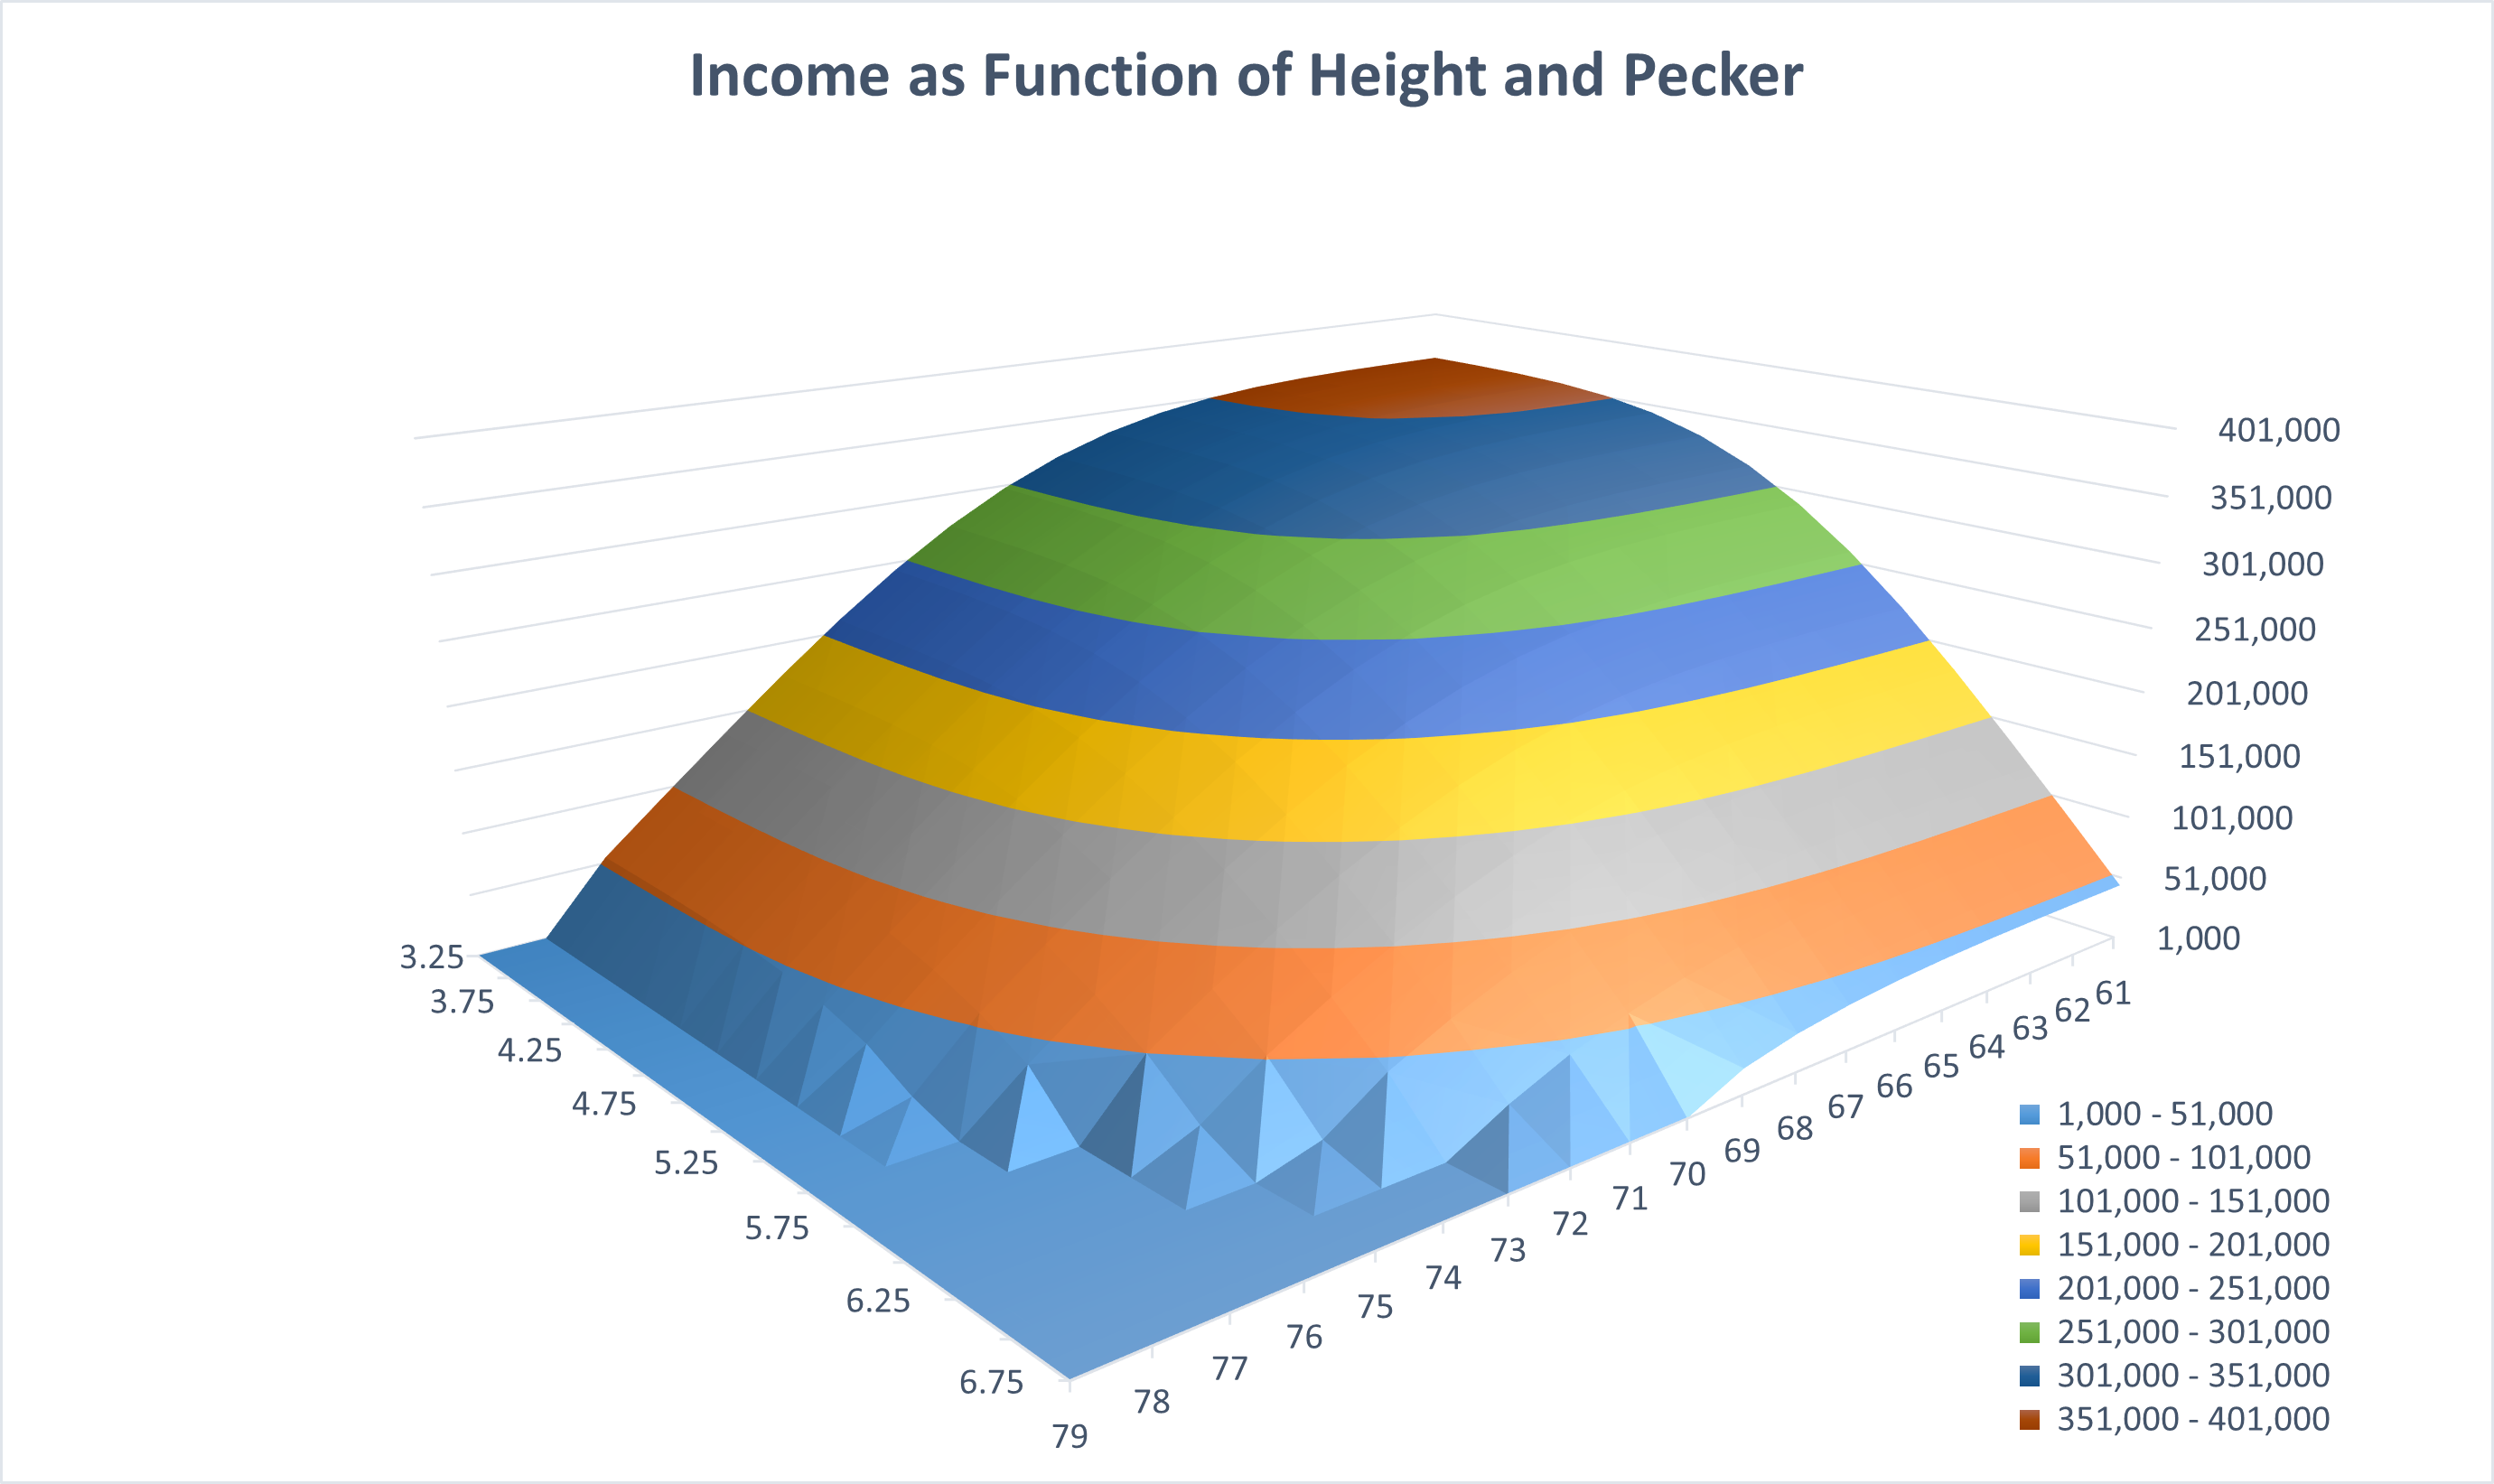
Now for fun, let's put salary on the z-axis and see just how high the "Peak of the Emasculated Rich" is. Remember, our income distribution doesn't include negative numbers, so we've created a floor for our lowest salary. Theoretically, we should expect the salary requirements to drop below zero at the extreme corner of the "Valley of the Sexy Hobo". Which of course suggests that our tallest and most well endowed men should actually be paid for their dating services.
How Much Should I Pay for an Inch?
Sadly, there isn't a linear relationship. I can't tell you that 1" of penis is always worth 10 Schrute bucks while an 1" of height is worth 75 Stanley nickels.
What we can do is model an inch based on your current measurements. We can brute force it using our laminated height vs pecker data table that we keep in our wallets at all times. For the Average Man, gaining an inch of height is worth losing roughly $25k in annual salary. Meanwhile, an inch of pecker is roughly offset by reducing annual salary by $128k.
But as pecker length hits the extremes, the extra inch of height becomes irrelevant. The same thing happens when talking about an inch of pecker for extremely short and tall guys.
What we need is a unifying equation that perfectly models the value of an inch in either department. I probably need to start practicing my Nobel acceptance speech.
The value of an inch of pecker can be modeled by:
$$1" of Pecker = e^{NORM.INV(1-\frac{BES}{Height_{ES}(N) * Pecker_{ES}})} - e^{NORM.INV(1-\frac{BES}{Height_{ES}(N+1) * Pecker_{ES}})}$$
Where N is your current height in inches and Blended Exclusivity Score is a constant defined as 0.425%. In preparation for my Nobel Prize, this constant should have a name. Perhaps "The Shallow Constant".
Life's Big Question
Earlier, I posed three big questions that keep many people up at night. Now that we finally have the framework, let's go about answering them as a bit of a wrap up.
Can you still date someone that is 5'3" if their income is $200k+?
I wish the answer was "Date whomever you love!", but sadly a 15 second clip on instagram authoritatively told me that there are rules. Three rules to be precise. Now, 5'3" is pretty short with an Exclusivity Score of 99%. But on the flip side, $200k is a pretty high income with an ES of 3.2%. Taken together, our Blended Exclusivity Score is 3.1%. Pretty exclusive, but still higher than our Shallow Constant of 0.425%. We just need to figure out what ESPecker we need.
$$0.00425 = 0.031 * ES_{Pecker}$$ $$ES_{Pecker} = \frac{0.00425}{0.031} = 0.137$$
This man is still dating material as long as their pecker has an ES of 13.7% or 5.88". Good to know he's still got a shot.
How tall does someone need to be to compensate for a micro-penis?
I don't really care to Google the exact definition of a micro-penis, so I'll just say that it's 3.5".
This question is actually pretty tricky, because the required compensation is dependent on the salary. Remember our peaks and valleys. To provide an answer, we will assume that we are thinking of the prototypical Three 6 man. This man went to bed 6' tall, with a 6" pecker and earning exactly $100k a year. How do we plan for the morning when he wakes up to a 3.5" pecker?
This new-found micro-penis has dropped the ESPecker from 10% to 99%. To compensate for that, the ESHeight has to increase by the same but opposite scale.
$$ \Delta ES_{Pecker} = \frac{.99}{.1} = 9.9$$
$$ \Delta ES_{Height} = \frac{1}{9.9} = 0.10101...$$
We can then multiply his current ESHeight by 0.10101 to get a new score of 0.25% or 75.9". This man needs to grow by almost 3" to compensate for his 2.5" pecker loss.
Is there a pecker length at which height and income become irrelevant?
Ahh, the man whose pecker is so long and so rare that he needs neither personality, height, nor salary to be a high-value target in the dating market.
The answer to this question is relatively straight forward. Remember that our ES are always between 0 and 1. They can only ever make you more exclusive, never less exclusive. We can ignore height and salary if our pecker has an ES of 0.425% by itself.
Plugging 0.425% into our NORM.INV() function determines that a pecker of 6.89" is the point at which you can forgo all other attempts at wooing the fairer sex.
But Why?
I warned you this was dumb, but dumb is fun. It's a cool way to explore data and concepts and not worry about getting everything right. I'm sure I got quite a bit wrong. Awesome, let me know and I'll learn a little bit more.